It’s never been easier to view actionable insights on your Wyng-built experiences. Read on to learn about the recent enhancements made to Experience Metrics.
One of the most frequently used features in Wyng is Experience Metrics. Experience Metrics show how your Wyng-built experiences are performing so you can scale what’s working and optimize where needed. Check out these updates that make it even easier to navigate Experience Metrics and surface actionable insights.
Easy Navigation to Drill Down Analyses
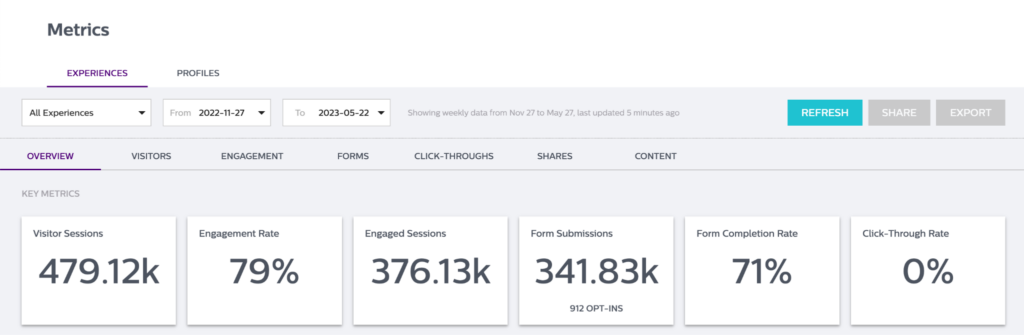
The Experience Metrics default view lands users on the “Overview” tab. Use the new tabs at the top (Visitors, Engagement, Forms, Click-Throughs, Shares, Content) to drill down into the metrics for each component of your experience. For example, click on “Visitors” to see which sources are driving the most visitor traffic to your experience, as well as most prevalent geographies or device type.
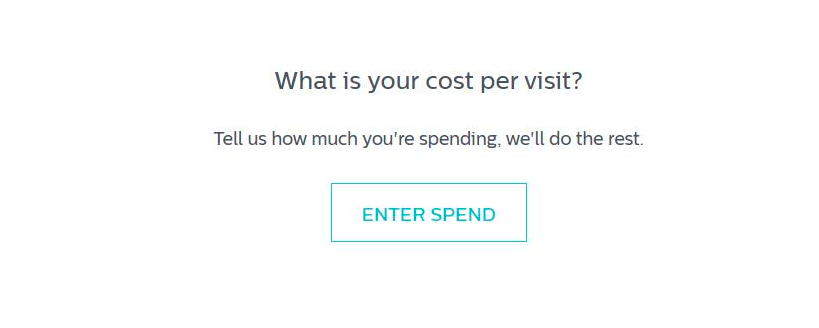
Quick Tip: On the “Visitors” tab you can calculate the cost of a visit by clicking Enter Spend and letting Wyng calculate the rest. This is a great way to compare ROI for various experiences.
New KPI: Engaged Sessions
Engaged sessions are the number of sessions that lasted longer than 10 seconds, had a conversion event, or had 2 or more screen or page views.
Engaged sessions help determine the performance of experiences without a form submission.For example, maybe you are hosting a landing page with a call-to-action to click through to another link – this would be a great time to use engaged sessions as a KPI! Another common use case would be for a spin-to-win or scratch-off without a form fill.
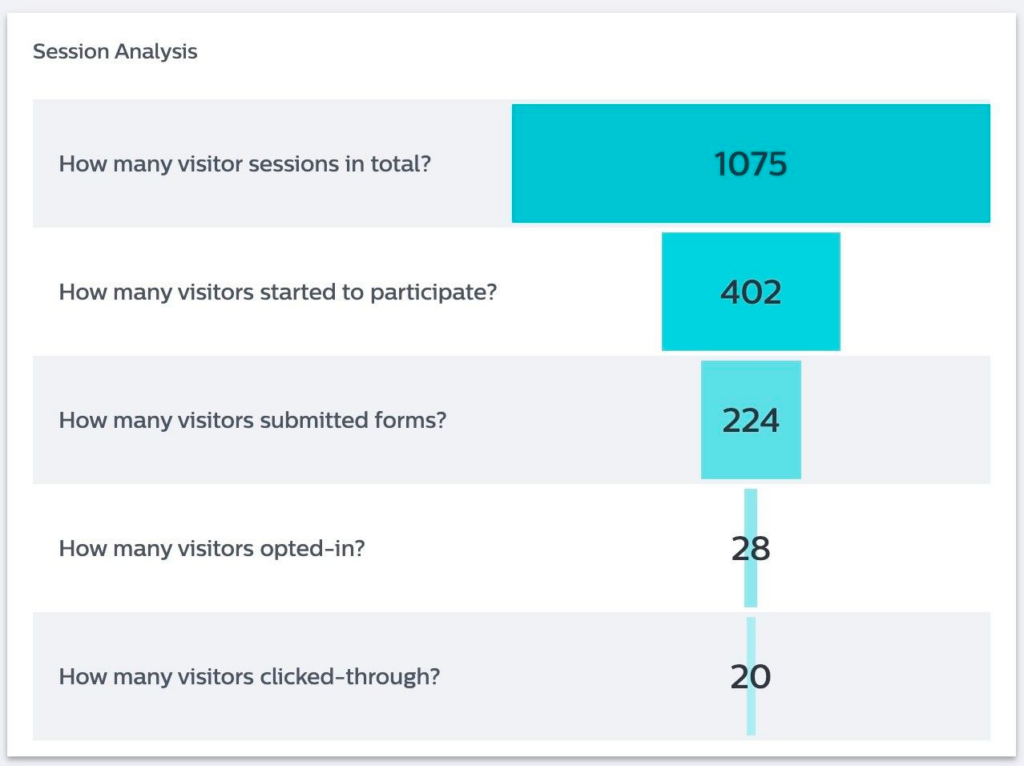
New View: Session Analysis Funnel
Easily track how visitors are progressing through the stages of an experience and assess the drop-off rate at each stage with the new Session Analysis Funnel, viewable in the “Overview” tab. Compare the Session Analysis Funnel for different experiences to compare performance and determine what tactics work best to progress visitors down the funnel.
Quick Tip: Have a lot of visitors starting your experience but dropping off before the end? Add a progress tracker and/or use copy to set the participants’ expectations (ex. Answer 5 questions to find your perfect moisturizer).
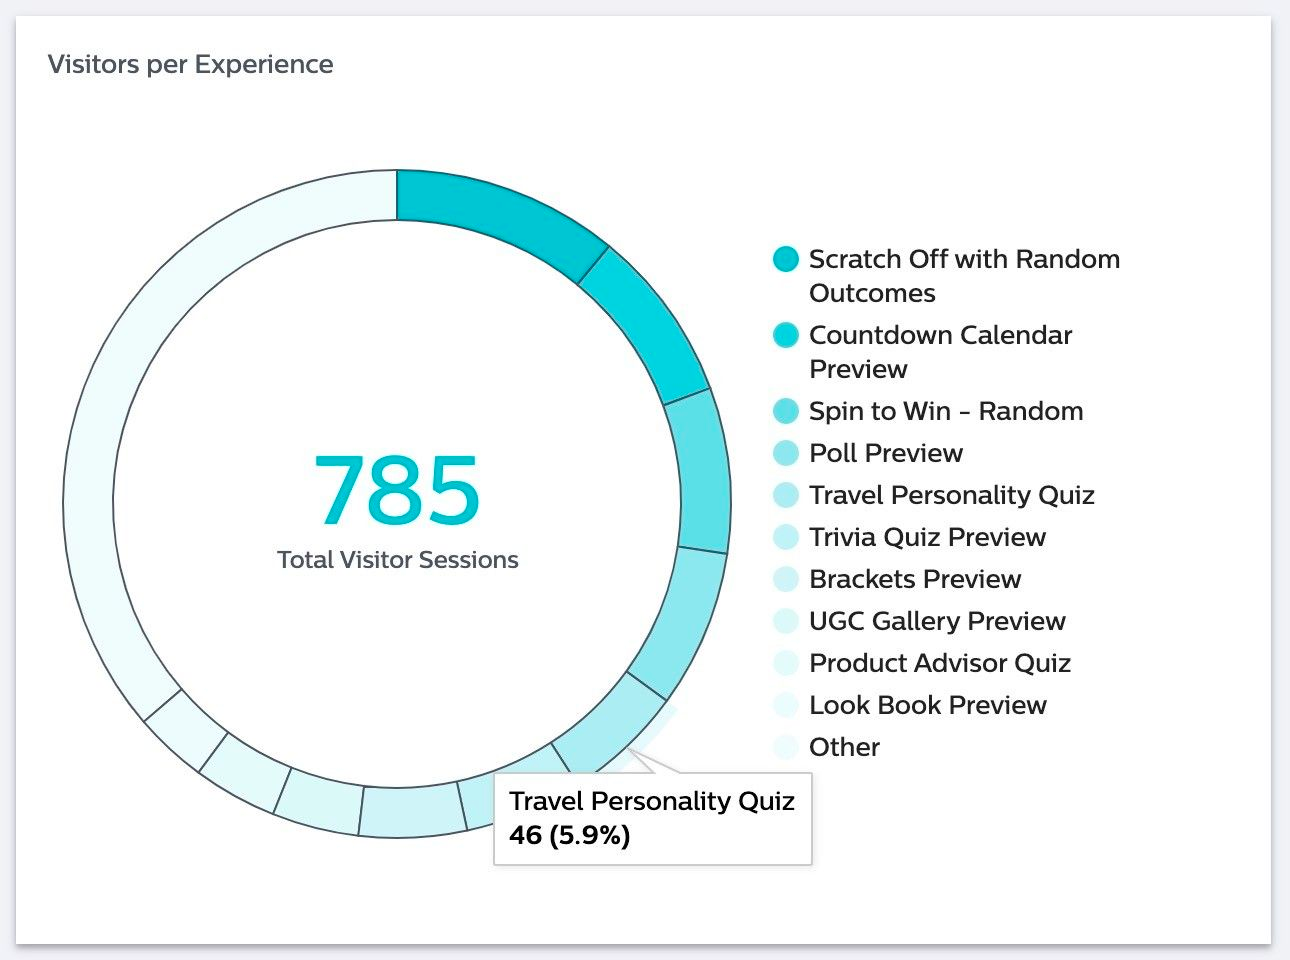
New View: Visitors per Experience Chart
To quickly determine which of your experiences drove the most visitor traffic over a certain period of time, use the new Visitors per Experience Chart, available in the “Overview” tab.
New Rate Cards Added to Overview
New cards showing various conversion rates have been added to the “Overview” tab. Rates can make it easier to compare experiences that have different amounts of visitor traffic. New rate cards include:
- Engagement Rate: The count of visitors sessions with at least one click / total number of visitor sessions, displayed as a percentage. Use this metric to understand how actively consumers are involved with your experience.
- Form Completion Rate: The count of visitor sessions with at least one form submission / total number of visitor sessions, displayed as a percentage. Use this metric to understand how many users completed the form submission.
- Click-Through Rate: The count of sessions with as least one click-through / total number of visitor sessions, displayed as a percentage. Use this metric to understand how many users clicked on an external link from within your experience landing page.
Additional Cards in Drill Down Analyses
In addition to the new cards available on the “Overview” tab, check out these other cards:
- “Forms” tab: Form Completion Rate for Engaged Users
- “Visitors” tab: Unique Visitor Sessions, Average Time on Experience
What's Next?
For existing Wyng customers, check out the Wyng Help Center for a full list of Experience Metrics available in the platform, with definitions. Or, if you are new to Wyng – start your free trial today! With a Wyng trial you can build a variety of digital experiences (product finder quizzes, gamified promotions, etc.) and start tracking the performance of those experiences with our built-in dashboards.